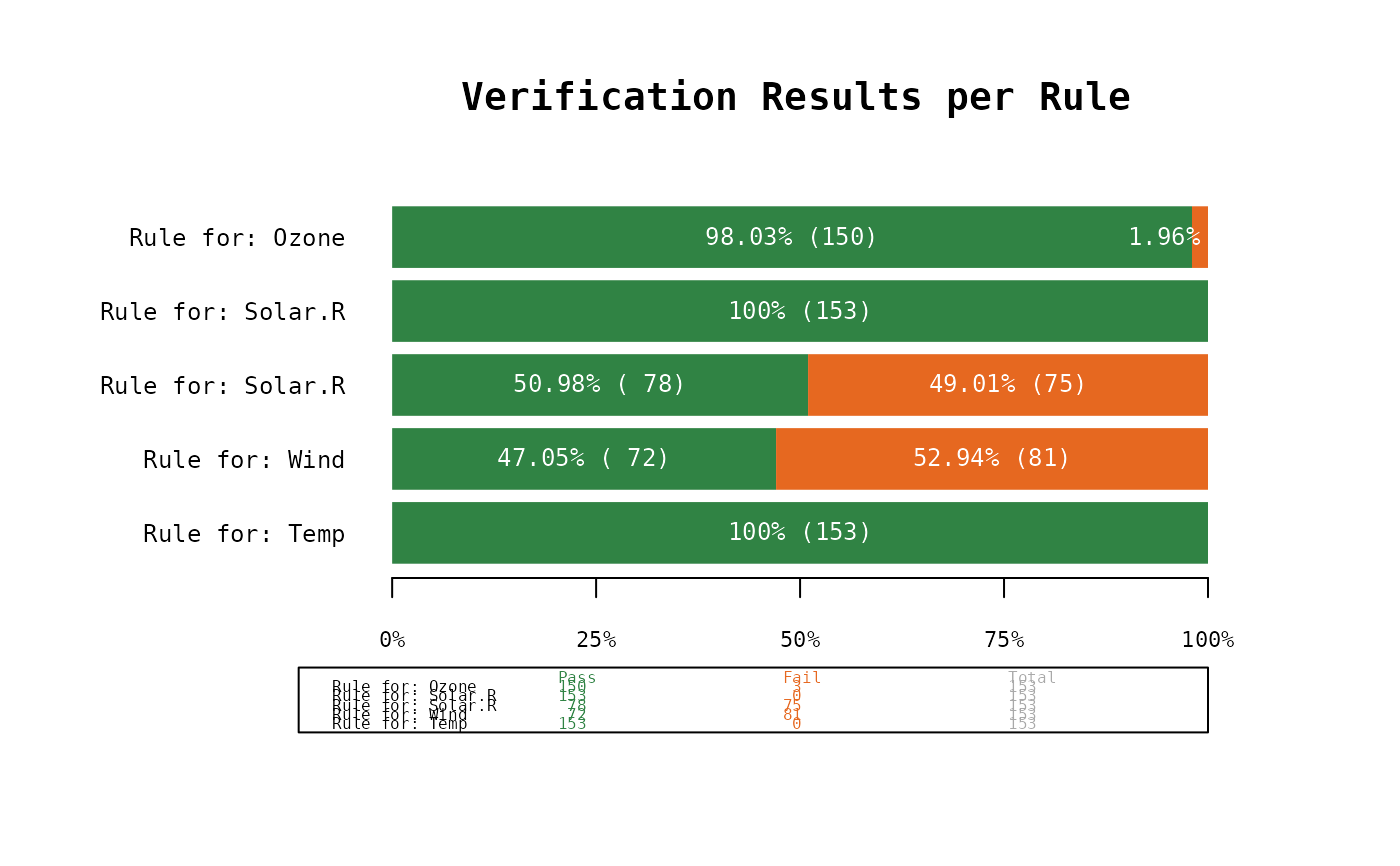
Visualize the results of a data validation
Usage
plot_res(
  res,
  main = "Verification Results per Rule",
  colors = c(pass = "#308344", fail = "#E66820"),
  labels = TRUE,
  table = TRUE
)
Arguments
- res
a data.frame as returned by
check_data()- main
the title of the plot
- colors
a named list of colors, with the names pass and fail
- labels
whether the values should be displayed on the barplot
- table
show a table in the legend with the values